Category Archives: Software Metrics
-

The Devil Is In The Details
Ever notice how dashboards never tell the whole story? Don’t you want to know what’s causing that spike in the chart? Example: Testing dashboard shows the number of test cases by status (passed/failed/not executed/etc.). They may even show the number of test cases by status per module/functionality for the application under test (AUT). That’s all […]
Continue Reading... -

Don’t Go Overboard. Keep It Simple Stupid!
Just because you can make pretty charts and pictures for metrics doesn’t mean you need to go haywire. When you are putting metrics together always keep K.I.S.S. (Keep It Simple Stupid) in mind. When putting any metric together ask yourself these questions: What do you want to show/prove? You can make charts for basically anything […]
Continue Reading... -

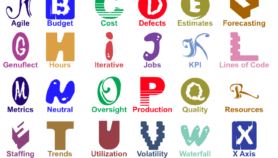
Do You Know Your ABC’s of Software Metrics?
Which letters do your metrics include?
Continue Reading... -

How Can You Manage What You Can’t See?
Metrics can be found everywhere but are they really showing you what you want/need to see? Take a look at the last defect metrics you put together or received. Does it look something like the image below? If your metrics look like the one above the questions that comes to mind should be but not […]
Continue Reading... -

Are Metrics Good or Evil?
People are constantly trying to measure something but are metrics good or evil? The answer can go either way depending on how you look at it. Metrics can be evil when: You try to measure data that is invalid and/or inaccurate You try to measure one data set to another that is not the same […]
Continue Reading...


